As a lifelong resident of the city, home has always been in midtown Toronto. In creating TorontoLivings, I wanted a place to share my experiences in the city, to educate our clients on the ever-changing market, and show people a side of the City that most don’t see every day.
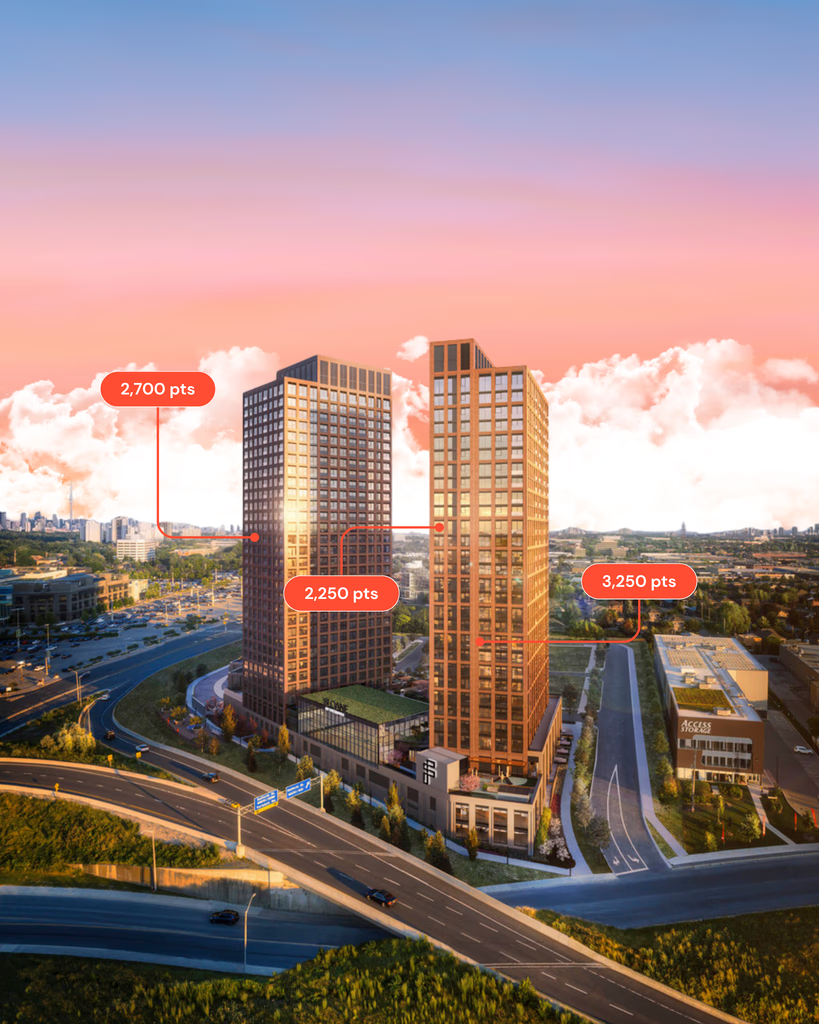
If you’re actively searching for a Toronto rental, here’s an incentive that genuinely stands out. Fitzrovia — one of Canada’s leading purpose-built rental developers — is now offering tenants the ability to earn Aeroplan points simply by paying their rent.
Yes, really.
Through a new partnership with Chexy, Fitzrovia renters can turn a monthly expense into meaningful travel rewards — a move that reflects how competitive (and creative) the Toronto rental market has become.
Earn Aeroplan® Points On Your Rent Payments
How the Aeroplan Rent Incentive Works
The concept is refreshingly straightforward:
Rent is paid through the Chexy platform, which allows tenants to pay using debit or credit cards
New leases may also qualify for a one-time Aeroplan signing bonus, depending on the building and promotion
Instead of a one-time free-rent offer, this incentive keeps delivering value month after month — whether that’s flights, hotel stays, or upgrades through the Aeroplan program.
Why This Is a Big Deal for Toronto Renters
Rent is already one of your largest monthly expenses. Turning it into something that helps fund travel or future experiences is a smart upgrade — especially for renters who value flexibility, lifestyle perks, and modern rental communities.
It’s also part of a broader trend we’re seeing: top-tier rental developers are focusing less on short-term discounts and more on long-term tenant value.
Why Fitzrovia (And Sloane) Are Worth a Closer Look
At Toronto Livings, we’ve already helped renters successfully secure homes at Sloane by Fitzrovia, a purpose-built rental community near Yorkdale known for its thoughtful layouts, elevated amenities, and transit-friendly location.
Now, with the ability to earn Aeroplan points on rent, Fitzrovia’s offering becomes even more compelling — especially for renters planning to stay put for a while.
If you’re weighing your options and want to understand which Fitzrovia buildings qualify, how the Aeroplan incentive works, or how to secure a unit before availability tightens, we’re happy to help.
Thinking about making a move? Send us a message below and let’s talk through your options and see whether a Fitzrovia rental — Aeroplan points included — makes sense for you.
Why Church Loft Living Still Captivates Toronto Buyers
According to the calendar, church loft conversions shouldn’t work as well as they do. Old buildings. Heritage restrictions. Layouts that don’t follow modern rules. And yet… buyers keep gravitating toward them.
What we hear most often from clients isn’t about square footage or amenities. It’s about owning something no one else can replicate. A home with history, permanence, and personality — in a city where so much new housing can feel interchangeable.
Below are our top five favourite church loft conversions in Toronto, based on first-hand client feedback, livability, architectural integrity, and long-term appeal. This isn’t a list of the flashiest buildings — it’s a list of the ones people truly love living in.
Originally St. John the Evangelist Anglican Church, this boutique conversion leans into restraint rather than drama. The exterior still reads unmistakably ecclesiastical, while the interiors feel calm, intentional, and timeless.
Why buyers love it
A sense of quiet luxury rather than overt loft theatrics
Elegant proportions and natural light over exaggerated ceiling heights
A location that feels residential, yet moments from Yorkville and Summerhill
Clients often tell us this building feels “settled” — in the best possible way. It attracts end-users who want character without chaos, and homes that age gracefully rather than chase trends.
2. College Street United Church Lofts – 456 College St
College Street United Church Lofts
If you picture a classic Toronto church loft, this is probably the building you’re imagining.
College Street United Church Lofts delivers the full architectural experience: soaring ceilings, dramatic arched windows, and a stone façade that anchors the corner of College Street with authority.
Why buyers love it
Volume and light that simply can’t be recreated today
A true sense of arrival — every unit feels distinct
Urban energy without sacrificing architectural soul
What consistently stands out here is pride of ownership. Buyers know exactly what they’re buying, and they buy it because nothing else compares.
St. Leslieville Church Lofts strikes one of the best balances we’ve seen between heritage character and everyday livability.
The building maintains its church presence without overwhelming the interiors, making it a favourite among buyers who want authenticity without sacrificing functionality.
Why buyers love it
A strong community feel within the building
Character-rich spaces that still work day to day
A quieter, neighbourhood-first east-end location
Clients often describe this building as warm and approachable — a place that feels special without feeling precious.
Smaller and more understated than many church conversions, Sunday School Lofts is what we often call a “hidden gem.”
Converted from an ancillary church structure rather than the main sanctuary, this building benefits from more traditional layouts while still retaining a heritage feel.
Why buyers love it
Boutique scale with low turnover
Practical layouts paired with subtle character details
A tucked-away setting just steps from Yonge Street
It’s especially popular with downsizers and professionals who want something different — but not difficult.
Arch Lofts makes no attempt to hide its origins — and that’s exactly the appeal.
With Gothic Revival architecture, dramatic stonework, and preserved arched windows, this conversion delivers immediate emotional impact the moment you walk in.
Why buyers love it
Strong visual identity and architectural presence
Old-world details paired with modern interiors
A sense of permanence that new construction can’t replicate
Buyers here tend to be design-forward and comfortable embracing character over efficiency — and they wouldn’t have it any other way.
Despite their differences, these church loft conversions share a few defining traits:
True scarcity — once you miss one, there may not be another for years
End-user appeal — people buy these homes to live in, not flip
Emotional connection — buyers remember the moment they walked in
And that’s the real takeaway. Church lofts aren’t about maximizing value per square foot. They’re about owning a space that feels meaningful.
Thinking About Buying a Church Loft?
If you’re exploring church loft living, understanding the nuances — from heritage designations to unit variability — makes all the difference.
You can learn more about how these conversions work in our Church Loft Conversions in Toronto guide, or scroll below to explore current church loft listings across the city.
As always, we’re happy to talk through what actually matters when buying one of these homes — and which buildings truly stand the test of time.
View All Church Lofts for Sale in Toronto
Church loft opportunities are rare, and when the right one comes up, timing matters. View all church lofts currently for sale in Toronto:
Buying a church loft in Toronto isn’t just a real estate decision — it’s a lifestyle choice. These conversions sit at the intersection of architecture, history, and modern urban living. For the right buyer, they can be incredibly rewarding. For the wrong one, they can feel unnecessarily complicated.
Over the years, we’ve helped countless buyers navigate Toronto’s loft market, and few property types spark as many questions as church conversions. So let’s break it down clearly: what makes living in a church loft special, where the trade-offs really are, and who these spaces tend to suit best.
What Is a Church Loft, Really?
A church loft is the residential conversion of a former place of worship — often dating back decades — into a small collection of loft-style homes. In Toronto, many of these churches were built in established neighbourhoods long before zoning, transit lines, or condo towers were ever part of the conversation.
Unlike factory or warehouse lofts, church conversions weren’t designed for residential use. That’s exactly what gives them their charm — and their quirks. Original sanctuaries become dramatic living spaces. Sunday school wings turn into stacked townhomes. Bell towers sometimes become private terraces.
If you want a deeper look at how these projects come together, we break it all down on our main page dedicated to church loft conversions in Toronto.
701 Dovercourt Rd – The Church Lofts
Why Buyers Are Drawn to Church Lofts
Architecture You Simply Can’t Rebuild Today
Vaulted ceilings. Exposed stone. Stained glass windows that cast light differently throughout the day. These are features that modern construction simply doesn’t replicate — at least not authentically.
Church lofts tend to feel more like custom homes than condos. Even years after completion, they still stand out in listing photos and in person. That architectural permanence is a big part of their long-term appeal.
Every Unit Is Genuinely One-of-a-Kind
One of the first things buyers notice when touring a church loft is that no two units are alike. Ceiling heights vary. Layouts shift. Windows aren’t symmetrical. In a market full of repetition, this individuality is refreshing.
From a resale perspective, uniqueness cuts both ways — but for buyers who value character, it’s exactly the point.
Quiet, Low-Density Living
Most church conversions are small by design. Fewer units. Fewer neighbours. Often no elevators at all.
That translates into quieter buildings, a stronger sense of community, and far less of the anonymous, hotel-like feel that comes with many high-rise condos. Short-term rentals are also far less common in these buildings.
The Realities Buyers Need to Understand
Heritage Restrictions Can Limit Changes
Many church lofts in Toronto are protected under some form of heritage designation. While this preserves the building’s character, it can also limit what owners are allowed to alter — particularly on exteriors, windows, and rooflines.
Interior changes are usually more flexible, but buyers should understand that heritage status is about stewardship as much as ownership.
Maintenance Costs Can Be Less Predictable
Older buildings come with older bones. Even when systems are updated during conversion, long-term maintenance can be less predictable than in brand-new construction.
Monthly fees don’t always tell the full story either. Church lofts often have fewer amenities, but higher per-unit responsibilities due to the size and complexity of the structure.
Smaller Condo Corporations Mean More Involvement
Church loft condo boards are typically small and owner-driven. That can be a positive — decisions feel more personal and less bureaucratic — but it also means owners are often more involved.
If you prefer a hands-off ownership experience, this is worth factoring in.
Financing, Insurance & Resale Considerations
The good news? Financing and insurance for church lofts have improved significantly over the years. Most major lenders are now comfortable with well-established conversions, especially those with strong reserve funds and clear management structures.
Resale value tends to track differently than conventional condos. Church lofts don’t always move in lockstep with broader condo trends, but they often hold value well over the long term because there simply aren’t many of them — and there won’t be more built.
Our First-Hand Experience at Heritage Towns at Hallam
The Heritage Towns at Hallam – 1183 Dufferin St
One of the clearest insights we can offer comes from our experience selling the entire Heritage Towns at Hallam community. We spent over two years on-site, working closely with buyers, from early sales through full occupancy.
What stood out most was how buyer perceptions evolved. Early on, many people focused on what these homes weren’t — they weren’t standard condos, they didn’t fit neatly into comparison charts.
Buyers began to appreciate the privacy, the character, and the sense that they owned something truly distinct. That experience continues to shape how we advise church loft buyers today: these homes reward patience, understanding, and the right expectations.
Are Church Lofts a Good Fit for You?
Church lofts tend to work best for buyers who value architecture over amenities, individuality over uniformity, and long-term enjoyment over short-term convenience.
If you want identical floorplans, predictable fees, and a fully hands-off ownership experience, this may not be your ideal fit. But if you’re drawn to history, design, and spaces that feel genuinely personal, it’s worth a closer look.
Quick Summary: Pros & Cons of Living in a Church Loft
Smaller condo boards require more owner involvement
Not ideal for buyers seeking uniform, turnkey living
Explore Church Lofts for Sale in Toronto
If you’re curious what’s currently available — or want guidance on whether a church loft fits your goals — you can explore all church lofts for sale in Toronto or reach out for a conversation grounded in real, firsthand experience.
At its core, a church loft conversion is exactly what it sounds like: a former place of worship that’s been thoughtfully reimagined into residential living. In Toronto, these conversions typically preserve the architectural bones of the original church — think soaring ceilings, stained glass windows, heavy masonry, and exposed timber — while introducing modern layouts, kitchens, and bathrooms behind the scenes.
Unlike former factories or warehouses, church buildings weren’t designed for production efficiency. They were designed for light, volume, and presence. That’s why church lofts are often considered some of the most dramatic and emotionally compelling examples of true hard loft living in the city.
For buyers who value character over cookie-cutter layouts, church loft conversions sit in a category of their own.
Macpherson Church Lofts – 12 Macpherson Ave
Why Toronto Has So Many Church Loft Conversions
Toronto’s relationship with church loft conversions didn’t happen overnight. It evolved gradually, shaped by changing demographics, shifting neighbourhoods, and the city’s growing appreciation for adaptive reuse.
Changing Congregations and Adaptive Reuse
From the mid-20th century onward, many Toronto congregations began to shrink, relocate, or merge. Large church buildings — often expensive to maintain — became underused, even as the surrounding neighbourhoods grew denser and more desirable. Rather than see these landmark buildings demolished, adaptive reuse became a practical and culturally sensitive solution.
Church conversions allowed Toronto to preserve neighbourhood landmarks while introducing low-density, character-driven housing into established communities — a win-win that still resonates today.
Why Churches Were Ideal for Loft Living
From a structural standpoint, churches were surprisingly well-suited for residential conversion:
Exceptionally high ceilings
Large, open-span interiors
Thick masonry walls and stone detailing
Oversized window openings, often with stained glass
These features translate into homes that feel light-filled, dramatic, and completely unlike conventional condos. No two units are ever truly alike — and for many buyers, that’s exactly the point.
A Personal Toronto Connection to Church Conversions
My connection to church loft conversions goes back well before my career in real estate.
In 1995 — long before church lofts were widely understood or marketed — the building was thoughtfully converted into just three residential loft homes. It’s a small, early example of adaptive reuse in Toronto, and one that quietly set the stage for how these buildings could evolve while still respecting their history.
That project left a lasting impression on me. Today, working with church loft conversions across the city doesn’t feel like a trend — it feels like a continuation of a Toronto story that’s been unfolding for generations.
View Church Loft Listings for Sale in Toronto
Church lofts are some of the rarest homes in the city — and they don’t always surface through standard condo searches.
We maintain a curated view of every church loft conversion in Toronto, including active listings, quiet opportunities, and buildings to watch. If you’re serious about finding the right one, having a clear picture of what’s available (and what rarely comes up) makes all the difference.
How Church Loft Conversions Actually Happen in Toronto
Church conversions in Toronto are rarely straightforward. Each project comes with its own set of planning, heritage, and design considerations.
Heritage Status and What It Really Means
Many churches in Toronto are either listed on the City’s Heritage Register or formally designated under heritage legislation. This doesn’t prevent conversion — but it does shape how it happens.
In most cases, heritage protections focus on preserving key exterior elements such as façades, rooflines, stonework, and window openings. Interiors are often more flexible, allowing architects and developers to balance modern livability with historical character.
The result? Homes that feel contemporary, but still unmistakably rooted in Toronto’s architectural past.
Planning, Zoning, and Condo Structures
Church loft conversions tend to result in boutique-scale projects. Some are converted into a handful of large lofts, while others incorporate townhome-style units or small condo corporations with very limited turnover.
This is why church loft buildings often feel more like private residences than traditional condos — and why opportunities to buy into them are so rare.
Saint Leslieville Church Lofts
Real Church Loft Conversion Examples in Toronto
Toronto has no shortage of standout church loft conversions, each with its own personality and architectural approach. A few notable examples include:
Arch Lofts on Perth Avenue, known for dramatic ceiling heights and original church detailing
Each of these projects reinforces the same idea: there is no such thing as a standard church loft.
What Makes Church Lofts So Different From Other Toronto Lofts
Church lofts aren’t just another variation of hard loft living — they operate by their own rules.
Layouts are often irregular. Ceiling heights can vary dramatically within the same unit. Sightlines, window placements, and architectural quirks are part of the package. For buyers who want predictability, this can be challenging. For buyers who want something unforgettable, it’s exactly the appeal.
Supply is also extremely limited. Once a church has been converted, there’s no second phase, no replication, and no mass production. What exists today is essentially all there will ever be.
Who Church Loft Living Is (and Isn’t) For
Church lofts tend to attract a very specific buyer profile:
End-users who plan to stay long-term
Buyers who value architecture and history
Those willing to trade efficiency for character
They’re often less appealing to investors seeking uniform layouts or frequent turnover. Church loft ownership is usually about lifestyle first — returns second.
Are Church Loft Conversions Still Happening in Toronto?
They are — but far less frequently than in the past.
As zoning becomes more complex and heritage considerations grow stricter, many remaining church sites are either too small or too protected for large-scale conversion. When projects do move forward, they tend to be boutique, design-forward, and highly customized.
This shrinking pipeline is one reason existing church lofts have become increasingly irreplaceable within Toronto’s housing landscape.
Exploring Church Loft Listings in Toronto
If church loft living speaks to you, access matters.
We track every church loft conversion in the city — past, present, and upcoming — and have access to listings that rarely fit into neat search filters. Whether you’re just starting to explore or waiting for the right opportunity, having context makes all the difference.
Explore current church loft listings in Toronto, or reach out if you’d like to talk through what makes these homes so unique.
Why Church Lofts Have Become Toronto’s Most Sought‑After Homes
Toronto has no shortage of condo options—but church lofts? Those are in a category of their own. Their appeal comes from a blend of history, architecture, and sheer scarcity. With only a limited number of former churches converted into housing, the supply stays tight while demand stays strong. It’s why these spaces attract everyone from creatives to downsizers looking for something with soul.
If you’re just starting your search, our full roundup of Church Loft Conversions in Toronto is a great place to explore what’s out there.
Explore Current Church Loft Listings in Toronto
One of the best ways to get a feel for what church loft living is really like is to browse the latest listings on the market. Because these homes are so rare, availability changes quickly—but when a special one hits the market, it’s worth seeing in person.
What Makes a Church Loft Different From a Regular Condo?
Authentic Character You Can’t Recreate
Church lofts carry features modern buildings simply don’t build anymore—vaulted ceilings, exposed beams, century-old brickwork, stained-glass windows, and dramatic open spaces. Some great examples across the city include:
Every one of these buildings has a completely different feel, which is part of the magic—and part of the challenge. No two floor plans are alike.
Unit Variability (And Why No Two Lofts Are the Same)
One of the most exciting—and occasionally challenging—aspects of buying a church loft is that layouts follow absolutely no rules. Instead of predictable floor plans stacked neatly across a tower, each unit is shaped by the original architecture of the church itself. That means you might find a mezzanine bedroom suspended above the living area, a kitchen tucked beneath century-old trusses, or a dramatic wall of restored brick that turns a simple hallway into a focal point. Windows may appear in unconventional places—arched, circular, stained glass, or set high above eye level—each contributing a different quality of natural light.
Rooms may have unexpected proportions, sweeping ceiling heights, cozy alcoves, or angled corners you won’t see in a typical condo. For buyers who love character, these quirks aren’t drawbacks—they’re the whole point. Every unit tells a story, and the individuality baked into these conversions is exactly what makes living in a church loft feel so personal and one-of-a-kind.
Victoria Lofts – 152 Annette St
Heritage Considerations Every Buyer Should Understand
Heritage Designation Levels & What They Mean
In Toronto, many church loft conversions fall under the City’s Heritage Register, which shapes how the building can evolve over time. A listing on the Heritage Register doesn’t freeze a property in place, but it does mean that any proposed changes—especially to the exterior—must be reviewed by Toronto’s Heritage Planning team.
Elements like original brickwork, arches, rooflines, stained-glass windows, and stone detailing are often protected, ensuring the character of the streetscape remains intact. Some buildings are fully designated, meaning even certain interior architectural features may be preserved, while others are simply listed, giving the City the ability to evaluate alterations before they happen. For buyers, the key takeaway is simple: renovations may still be possible, but they require proper approvals and often specialized trades familiar with heritage conservation.
Renovation Restrictions (Especially in True Conversions)
Heritage renovations require time, patience, and often specialized trades. Stained-glass restoration, masonry conservation, and wood beam reinforcement are not your average condo reno projects. Buyers planning upgrades should understand the process early.
The Structural Checklist: What to Inspect Before You Offer
Rooflines, Trusses & Insulation
Those soaring ceilings come with real engineering behind them. Some lofts have spray-foam insulation; others retain original rafters with added thermal layers. Temperature balance can vary from unit to unit—worth checking during a showing.
Windows, Stained Glass & Maintenance Costs
Stained-glass windows are stunning, but repairs can be pricey. Replacement isn’t always straightforward if the building is protected under the Heritage Act. A healthy reserve fund is essential.
Plumbing, Electrical & Mechanical Systems
Most conversions overhaul major systems, but not all do it equally. Inspectors should look for:
Updated wiring and electrical panels
Modern plumbing stacks
Recently serviced HVAC systems
Because these buildings are small, many rely on boutique contractors, which can increase costs.
West 40 Lofts – 40 Westmoreland Ave
Understanding the Condo Corporation in a Church Loft
Church loft conversions in Toronto almost always operate as boutique condo corporations, which means their financial structure and long‑term planning can look very different from what buyers might expect in a larger, more conventional condo.
With fewer residents contributing to the reserve fund, these buildings often have tighter budgets and a higher sensitivity to upcoming repairs—especially when it comes to heritage materials like brick masonry, stained-glass windows, or century‑old rooflines that require specialized trades. A close review of the status certificate becomes essential, not just to understand the reserve fund balance, but to get clarity on past or pending special assessments, insurance costs, and any major restoration work scheduled for the next few years.
Parking and storage can also be limited, since most churches weren’t originally designed with underground infrastructure in mind. Altogether, buyers should think of these buildings as small communities: charming, character-filled, and deeply unique—but requiring a more thoughtful look at the condo corporation’s health before making an offer. Some owners rely on street permits or creative solutions.
Market Trends: How Church Lofts Perform Over Time
Why Scarcity Drives Value
Church conversions are rare—and they aren’t building more of them. That limited supply keeps values strong and resale demand healthy. Even in slower markets, unique lofts tend to outperform because they attract a very specific buyer pool.
How TorontoLivings Has Seen This Play Out First-Hand
When the right loft hits the market, it moves quickly. Serious buyers should have financing ready and a strong grasp of the building’s history and financials.
Final Thoughts: Why Church Lofts Remain One of Toronto’s Most Captivating Home Types
Church lofts sit at the intersection of history, architecture, and personal expression. They’re rare, dramatic, and deeply individual—perfect for buyers looking for something that feels less like a condo and more like a story.
If you’re ready to explore the best lofts available today, start with our full guide to Church Loft Conversions in Toronto or reach out—we’d be happy to walk you through the truly special ones!
According to the calendar, we’re officially in “hot chocolate and thicker jackets” season… and according to November’s numbers, the Toronto real estate market has also settled into full fall mode.
November wasn’t dramatic or chaotic. Instead, it felt like a market catching its breath—slower pace, fewer listings, and more thoughtful buyers. But tucked inside the overall cool-down was a standout story: freehold homes between $1M and $1.5M were buzzing with real activity. Let’s break down what actually happened.
What Happened in the Toronto Market This November?
Sales Slipped—But It’s Not the Plot Twist You Might Expect
Toronto recorded 5,010 sales, an 18.38% drop from October. On the surface, that might look like a steep fall… but November is historically a slower month as buyers shift into “holiday mode” and sellers decide to wait out the year.
The interesting part? Even with fewer deals happening, conversations with buyers stayed lively. This wasn’t a demand problem—it was a “let’s be picky” moment.
New Listings Dropped Harder Than Sales
Only 11,134 new listings hit the market in November—a sharp 30.7% drop. That’s the real story of the month. Sellers stepped back in a big way, which meant that buyers who were actively shopping suddenly had fewer homes to choose from.
When new listings fall faster than sales, the market tightens. And that’s exactly why prices held steady.
Even Active Listings Declined More Than Usual
Active inventory fell to 24,549—nearly 12% lower month-over-month.
Buyers who remained committed in late fall described the experience as “I’m ready… but there’s nothing to see.” Anyone who has been through a November search knows the feeling.
Prices Held Steady (All Things Considered)
Average Price: $1,039,458 (Down just 1.4%)
You might expect a bigger price swing with slower sales, but Toronto homes proved resilient. Prices barely budged and stayed right in line with where they’ve been for most of the year.
Think of it as the market saying: “Relax, nothing dramatic happening here.”
Days on Market Hit Their Longest Stretch This Year
The ‘Days on Market” rose to 56 days, the slowest pace we’ve seen in 2025.
This doesn’t mean homes aren’t selling—it means buyers are taking their time, comparing options, and running the numbers twice. But again… this was not the case everywhere.
The Breakout Segment: Freehold Homes Between $1M and $1.5M
Here’s where things get fun.
Detached & Semis in This Range Moved Faster Than the Market
Despite the overall slowdown, this pocket of the market stayed lively. In the 416:
Detached homes saw 600 sales
Semis hit 209 sales
Not record-breaking, but the energy was noticeably stronger. Freeholds that were move-in ready, offered rental potential, or were located near transit didn’t sit long.
Why? Because this price band continues to hit that Toronto sweet spot: attainable for move-up buyers, attractive to investors, and competitive enough to avoid the bidding-war chaos of earlier years.
Condos and Townhouses: Softer Demand, Stable Pricing
Condos Took a Breath After October’s Spike
Condo sales dipped to 880 (a 17.9% decline). No surprise here—condo buyers tend to be more rate-sensitive, and many are waiting for early 2026 announcements before locking in.
Yet, the average condo price actually inched up to $701,259. That’s the stability story again.
Townhouses Were a Mixed Bag
Townhouses landed at an average price of $870,793, a modest 2.2% dip.
Still, they continue to appeal to buyers who want the space of a freehold but not the price tag of one. The townhouse segment is very much alive—it’s just quieting down with the rest of the market.
Big Picture Trends Shaping Toronto’s Market Right Now
Mortgage Rates Are Finally Helping
After the Bank of Canada’s gradual cuts, many 5-year fixed rates now sit in the mid-4% to low-5% range. Buyers aren’t sprinting back, but confidence is noticeably higher than in 2023–2024.
If you talk to anyone who started a pre-approval a year ago and renewed it recently, they’ll tell you the same thing: “This feels manageable again.”
Consumers Are More Hopeful—But Still Cautious
Renewals at higher rates are still holding some would-be sellers back, especially those locked into ultra-low pandemic mortgages.
But newcomers, families, and investors are fueling the activity we do see—especially where rental income or multi-unit potential exists.
Policy Shifts Are Playing a Quiet but Important Role
With Bill 60 improving LTB timelines and clarifying the N12 process, landlords and investors are planning ahead with more certainty.
Meanwhile, Toronto’s ongoing gentle-density permissions are quietly changing how buyers view freehold lots—especially those with laneway or basement suite potential.
What Buyers Should Take Away From November 2025
Where the Opportunities Are
Freeholds under $1.5M: competitive, but not overwhelming.
Condos: stable prices + motivated sellers = room to negotiate.
If confidence rises, expect buyers to move from browsing to buying.
Thinking of Buying or Selling?
Whether you’re upsizing, downsizing, or investing, November’s data tells us the same thing: this is still a market with opportunities—just not the loud, dramatic kind.
If you’re shopping for a home in Toronto over $3 million, you’re not just buying into a neighbourhood—you’re buying into a tax bracket.
Between the provincialland transfer tax and Toronto’s own municipal land transfer tax, high-end buyers are paying some of the steepest closing costs in the country. And now, with talk of even higher taxes on “luxury” homes, the $3M line has become a psychological—and financial—wall for a lot of buyers.
Let’s break down what’s really going on at the top end of the market, and what it means if you’re buying or selling above $3M in Toronto.
Toronto’s Luxury Land Transfer Tax in Plain English
Toronto is unique in Canada because you pay two land transfer taxes on a purchase:
Ontario’s provincial land transfer tax (LTT)
Toronto’s municipal land transfer tax (MLTT)
Both are tiered taxes—different portions of the purchase price are taxed at different rates. For provincial LTT, Ontario applies: 0.5% on the first $55,000, 1% up to $250,000, 1.5% to $400,000, 2% up to $2,000,000, and 2.5% on anything over $2,000,000.
Toronto’s municipal tax mirrors those lower tiers, but as of January 1, 2024, the City introduced new luxury brackets for high-value homes:
3.5% on the portion between $3M–$4M
4.5% on $4M–$5M
5.5% on $5M–$10M
6.5% on $10M–$20M
7.5% on $20M+
These luxury rates apply only to properties with at least one, and not more than two, single-family residences—think detached, semi, or certain townhomes—inside Toronto’s boundaries.
So if you’re buying in Forest Hill, Lawrence Park, the Bridle Path, or a renovated detached in central Toronto, you’re very much in luxury-tax territory.
How Much Tax Are We Actually Talking About?
To keep things simple, let’s look at approximate totals for a buyer in Toronto (provincial + municipal combined), using the current bracket structure:
$3,000,000 purchase
Roughly $61,500 in Ontario LTT
Roughly $61,500 in Toronto MLTT
Total: about $123,000 in land transfer tax
$4,000,000 purchase
Roughly $86,500 in Ontario LTT
Roughly $96,500 in Toronto MLTT (thanks to that 3.5% luxury tier)
Total: about $183,000 in land transfer tax
$5,000,000 purchase
Roughly $111,500 in Ontario LTT
Roughly $141,500 in Toronto MLTT
Total: about $253,000 in land transfer tax
These are ballpark figures based on the official rate structure from the Province and the City; every deal should still be run through a lawyer or a reliable calculator for precise numbers.
The takeaway? Once you cross into the $3M+ bracket, your land transfer tax bill alone can rival the price of a condo parking spot… or three.
Why $2.99M Has Become the New Line in the Sand
Here’s what we’re seeing on the ground: buyers are pushing hard to cap their purchase at or below $3M.
When you know that every extra dollar above $3M gets hit with a 3.5% municipal luxury levy on top of the provincial 2.5% over $2M, it’s no surprise that:
Some buyers are setting their saved searches to $2.8M or $2.9M max
Offer strategies are being crafted very intentionally around “Do not cross $3M”
Properties listed just above $3M are facing more resistance—and sometimes longer days on market—than those priced just under
From our side at TorontoLivings, we’ve seen more purchasers push to get their luxury house “until $3 million.” That behaviour lines up with what other brokers and analysts are calling “threshold compression”—activity bunching just below key policy lines.
How Sellers Are Responding
Sellers above $3M are adapting too:
Pricing homes at $2,995,000 instead of $3,050,000
Being more open to offers just under $3M to keep buyers out of the higher tax band
Investing more in presentation and marketing to justify a price that does cross the line
When tax policy starts driving list prices and offer strategies, it’s a sign the luxury LTT isn’t just a background closing cost anymore—it’s actively shaping the market.
If you’re thinking about selling in that range, it’s worth a conversation about strategy—especially around pricing. Our Sell Higher guide walks through how we position listings in shifting markets like this.
Did the Luxury Tax Actually Raise Revenue—or Just Headaches?
The stated goal of Toronto’s luxury MLTT changes was to raise more money from a relatively small slice of high-value deals. Law firms and policy observers noted that City Hall was trying to plug budget gaps, alongside other tools like higher parking fees and calls for new revenue sources.
On the flip side, industry groups—especially the Toronto Regional Real Estate Board (TRREB)—have been blunt: they argue that piling more tax onto home purchases, particularly in a city already dealing with affordability issues, could drive buyers away and reduce transaction volume at the top end.
You don’t have to read the full policy submissions to see the impact. Just look at:
Slower absorption above $3M in certain neighbourhoods
More buyers comparing “Toronto vs just outside of Toronto”
A growing sense, especially among move-up buyers, that “maybe we don’t need that extra bedroom if it comes with six-figure tax”
We’ve seen this play out before with other city policies—think of the Toronto Vacant Home Tax and how it changed the calculus for certain owners. The luxury LTT is doing something similar, just at a different price band.
And Now… Talk of Even Higher Taxes on “Luxury” Homes
Just as the market was getting used to the new 2024 brackets, the conversation moved again.
Recent reporting has highlighted that Mayor Olivia Chow is proposing to increase the tax rates on higher-value home sales even further, including those between $3M and $4M and above. In broad strokes, the idea is to bump the municipal luxury rates by roughly 0.9 to 1.1 percentage points in the upper tiers, pushing the MLTT on a $3M–$4M home toward the mid-4% range.
The pitch from City Hall is simple: these are the wealthiest buyers in the city, and asking them to contribute more helps fund services that everyone uses.
TRREB’s counter-argument is just as simple: stacking more tax on already expensive homes risks slowing the market and pushing activity outside city limits.
Why This Matters Even If You’re “Just Browsing”
Even without exact implementation details, the message to luxury buyers is loud and clear:
Taxes at the top end are not done evolving
The $3M line is likely to become even more sensitive over time
If you’re considering a long-term primary residence in the $3M–$5M range, you’ll want to model closing costs carefully
It also means that timing—and where you buy—matters more than ever.
How Toronto’s Luxury Tax Compares to Buying Just Outside the City
Here’s where things get interesting.
If you buy in Oakville, Mississauga, Vaughan, Markham, or other 905 municipalities, you still pay Ontario’s provincial LTT, but you do not pay a municipal land transfer tax like Toronto’s.
On a multi-million-dollar purchase, skipping the municipal side can mean tens of thousands of dollars in savings.
Roughly speaking:
A $3M home in Toronto = two layers of land transfer tax
A $3M home in Oakville or Vaughan = one layer (provincial only)
Of course, that doesn’t mean everyone should default to the 905. You’re also trading:
Commute time
School options
Neighbourhood character
Access to downtown amenities
But it does explain why we’re seeing some luxury-segment buyers:
Cross-shopping central Toronto vs. Oakville waterfront, or
Looking at newer builds in Vaughan instead of a slightly dated detached in the city core
If you’re shopping above $3M in Toronto, here are a few practical moves:
1. Model the Total Cost, Not Just the Purchase Price
Run scenarios at:
$2.95M
$3.05M
$3.5M
You’ll see how quickly the combined land transfer taxes add up as you cross different thresholds. A good real estate lawyer or a reputable online calculator can give you precise numbers.
2. Build the Tax Into Your Negotiation Strategy
If you’re hovering around $3M, consider:
Structuring offers to stay under the threshold
Highlighting the tax jump when negotiating with the seller
Looking slightly under your max budget, knowing the tax bill will fill in the gap
We’re seeing many buyers treat the luxury LTT as part of the “effective price” of the home—not an afterthought.
3. Think Long-Term, Not Just “Sticker Shock”
Yes, the upfront tax is painful. But if you’re buying a home you’ll live in for 10–15 years, the question becomes:
“Is this the right home, in the right area, for the life I want… even with the tax?”
That’s where conversations about schools, commute, future renovation potential, and resale come into play. We’re big believers in matching the home and the life, not just the budget.
What Sellers Above $3M Need to Watch
On the selling side, the luxury LTT changes should play into your pricing and marketing decisions.
1. Pricing Around the Threshold
If your home’s fair-market value is somewhere between $2.9M and $3.2M, the difference between listing at $2,995,000 vs $3,099,000 is no longer just a rounding error—it’s a psychological barrier for buyers who’ve already run the tax math.
A thoughtful pricing strategy can:
Expand your buyer pool
Reduce friction during negotiations
Shorten days on market in a segment that’s naturally thinner
2. Justifying a Price Above $3M
If you are clearly above the line—say in the $3.5M+ range—your marketing needs to answer:
“Why this house?”
“Why this neighbourhood?”
“Why is it worth the extra tax, not just the extra price?”
This is where high-quality visuals, floor plans, neighbourhood storytelling, and a strong digital strategy matter. You’re not just selling a house—you’re selling the argument that this specific property is worth carrying the tax burden.
If you’re curious how we approach that, our Sell Smarter page walks through our system for maximizing value in markets exactly like this.
Final Thoughts: Is Toronto’s Luxury Market Adapting… or Migrating?
Luxury buyers in Toronto are facing a triple reality:
High base prices for quality homes
Stacked land transfer taxes (provincial + municipal, with luxury tiers over $3M)
Talk of even higher rates on “luxury” properties going forward
Some will adapt—tightening their search to just under key thresholds, negotiating harder, and focusing on homes they’ll keep for the long haul.
Others will migrate—to neighbouring municipalities with similar homes but lighter tax loads.
Either way, if you’re buying or selling above $3M in Toronto, this isn’t background noise anymore. It’s a core part of your strategy.
If you’re trying to make sense of your own numbers—whether you’re on the buy side or the sell side—feel free to reach out. And if you want to keep tabs on how policy and market trends evolve from here, make sure you’re subscribed to our market updates so you’re never guessing about what City Hall (or the market) is planning next.
What’s Changing — Bathurst & Dufferin’s New Priority Lanes
Toronto is rolling out priority transit lanes along two of the city’s busiest north–south corridors: Bathurst Street and Dufferin Street. If you’ve driven, ridden, or walked these stretches recently, you’ve likely felt the congestion firsthand.
The new configuration introduces red-painted priority lanes designed to keep TTC vehicles moving. On Bathurst, the priority lanes run roughly 3.4 km from Bathurst Station down to Lake Shore, converting centre lanes to streetcar-only sections and removing pockets of on-street parking. Dufferin will see curbside bus/streetcar lanes from Dufferin Station down to King Street West, paired with new signage, turn restrictions, and loading-zone adjustments.
It’s a major shakeup for two corridors that serve tens of thousands of daily riders — and thousands of drivers who now have one less lane to work with.
Why the City Is Doing This — Transit, Congestion & the 2026 World Cup
According to the City of Toronto and the TTC, both streets have reached a breaking point. Streetcars are routinely slowed to a crawl by general traffic, frequent stops, and parked or turning vehicles. Bus service on Dufferin — one of the busiest surface routes in the city — faces the same fate.
The plan is part of RapidTO, a city-wide initiative investing in dedicated transit lanes to improve reliability. And yes, there’s also a deadline: Toronto is hosting World Cup 2026 events, meaning the city needs faster and more predictable ways to move huge crowds along these central corridors.
In theory, riders should see:
Shorter travel times
More reliable service
Fewer “bunching and gaps” on streetcar and bus routes
But there’s a tradeoff — and it’s a big one.
What Riders & Drivers Should Expect — Gains, Losses & Growing Pains
Let’s be honest: traffic on Bathurst and Dufferin already feels painfully inefficient, especially during rush hours. Removing mixed-traffic lanes won’t magically unclog the streets — if anything, drivers may feel the pinch even more.
Drivers may experience:
Longer north–south travel times
More congestion from lane reductions
Loss of on-street parking in key segments
New turn restrictions
Transit riders may experience:
Faster, more predictable streetcar/bus trips
Fewer service delays caused by stalled traffic
Local businesses are watching closely. Beyond concerns about customer parking, many will face tougher delivery logistics. With curb lanes shifting to transit‑only use, delivery trucks will have fewer legal loading zones, forcing drivers to circle longer, park farther away, or schedule drop‑offs during off‑peak hours. For businesses that rely on frequent shipments — restaurants, retail shops, service vendors — even small delays can add up quickly. Some rely heavily on street parking and fear these changes could redirect customers elsewhere. Residents have also voiced concerns about cars diverting onto side streets — a natural byproduct of any major lane reallocation.
RapidTO: Bathurst Street
What It Means for Neighbourhoods & Real Estate
Transit accessibility has always played a big role in Toronto’s real estate story. When commuting becomes easier, neighbourhood desirability often rises with it.
For many buyers, being close to a reliable transit line is a bigger priority than owning a parking spot. These changes could boost the appeal of homes, condos, and rentals along Bathurst and Dufferin — especially for people who value car-free or car-light living.
For drivers? The reaction might be mixed. Increased congestion or reduced parking could nudge some homeowners toward quieter streets or areas with better road access.
But overall, improvements to public transit tend to strengthen neighbourhood demand over the long term.
Our Take — A Tough Transition, with Long‑Term Gains
From our experience moving around the city daily, we know how frustrating things already are: Traffic is already jammed, and these improvements won’t fix driving anytime soon.
But if the goal is to move the most people efficiently, dedicated transit lanes make sense. And in a city growing as fast as Toronto, prioritizing the TTC — the system most people rely on — feels like the right long-term play.
Will it be painful for drivers? Absolutely.
Will it help transform two notoriously slow corridors into reliable transit spines over time… we’ll see!
One more wrinkle worth noting: it’s still unclear when the lanes will officially become enforced TTC-priority lanes, and the City hasn’t yet confirmed what fines drivers might face for entering or stopping in them once enforcement begins. Until those details are finalized, expect a transition period where rules, signage, and compliance continue to evolve.
Introduction — A Big Shift in Ontario’s Rental Rules
Ontario’s rental market has been running hot for years — rising demand, tight supply, and a Landlord and Tenant Board (LTB) so backlogged that some hearings took months, even years. Both landlords and tenants felt stuck in a system that wasn’t working.
Enter Bill 60, a sweeping update to Ontario’s Residential Tenancies Act. It’s designed to speed up decisions, reduce delays, and (according to the province) help restore fairness between tenants and landlords.
And from where we sit, this bill feels like a welcome shift — one that begins to balance the scales of fairness while creating clearer, more predictable rules for everyone involved.
What Is Bill 60?
Bill 60 — formally known as the Fighting Delays, Building Faster Act — introduces several changes to how rental disputes are handled in Ontario. It tightens timelines, limits last-minute curveballs at hearings, and adjusts how certain evictions work.
The goal? Faster resolutions. More predictability. And fewer situations where good landlords (and good tenants) are stuck navigating endless delays.
Key Changes Landlords & Tenants Need to Know
1. Faster Path to Eviction for Non-Payment of Rent
Under previous rules, landlords needed to wait 14 days after a missed payment before issuing an N4 notice. Bill 60 cuts that in half — just 7 days of arrears can trigger the notice.
What it means:
For landlords: quicker action on serious arrears.
For tenants: less buffer for late payments — communication is crucial.
2. Limits on Tenants Raising New Issues at LTB Hearings
Historically, tenants could introduce last-minute concerns (maintenance, safety, harassment) during a non-payment hearing — often leading to adjournments.
With Bill 60, new issues can only be raised if the tenant prepays 50% of the arrears being claimed.
It’s a big shift, aiming to reduce delays — but critics argue it may silence legitimate tenant concerns.
3. Shorter Appeal Windows at the LTB
Appeal periods shrink from 30 days down to 15 days.
Faster decisions mean:
Landlords can regain units sooner.
Tenants need to act quickly if they plan to challenge a ruling.
4. Changes to Landlord-Use Evictions (N12)
When a landlord or an immediate family member wants to move into a rental unit, Bill 60 removes the requirement to:
offer the tenant another available unit, or
provide one month’s rent as compensation.
As long as proper 120-day notice is given, compensation is no longer mandatory.
This reduces costs for landlords — and may reduce disputes around bad-faith claims — but raises questions about tenant security.
5. Other Process Improvements
Future system upgrades aim to:
Digitize more of the LTB process
Increase staffing
Reduce decision timelines
We’ll be watching closely to see how quickly these improvements materialize.
Investors pulling back due to risk and unpredictability
Rapid growth in renter households
The province claims a faster system benefits everyone — tenants get timely decisions, and landlords avoid months of uncertainty.
How Tenants Are Affected
Reduced Security of Tenure
Cutting timeframes makes eviction processes faster and more decisive. For tenants who fall behind due to emergencies, this leaves less flexibility.
Barriers to Raising Maintenance Concerns
If a tenant can’t pay 50% of arrears, it becomes harder to bring legitimate complaints forward during a hearing.
Concerns Around Personal-Use Evictions
Without compensation requirements, displaced tenants must navigate Toronto’s high rental prices without financial support.
How Landlords & Investors Are Affected
More Predictability and Stability
Bill 60 brings clearer expectations around timelines — reducing risk for small landlords who depend on rental income.
Fewer Bad-Faith Claims
Limiting last-minute hearing surprises should reduce delays and adjournments.
Greater Confidence for Purpose-Built Rentals
With smoother dispute resolution, developers may feel more comfortable building much-needed rental supply.
Our Take: Does Bill 60 Actually Balance Things Out?
The rental system wasn’t working — not for landlords, not for tenants. Bill 60 doesn’t fix everything, but it does introduce more structure, fewer delays, and clearer expectations.
From our perspective, this is a welcome change. It begins to restore balance, making the process more fair for everyone involved.
Practical Advice for Tenants and Landlords
For Tenants:
Stay on top of payments — the 7-day grace period is strict.
Document all issues with the unit.
Know your rights around eviction and notices.
For Landlords:
Update your tenant communication and onboarding materials.
Keep records of all correspondence.
Use N12 responsibly — penalties for misuse still apply.
Conclusion — A New Chapter for Ontario’s Rental Landscape
Bill 60 brings meaningful updates to an overburdened system. While not perfect, the changes aim to improve predictability, fairness, and efficiency.
For landlords and tenants navigating Toronto’s tight rental market, understanding these new rules is essential — and staying informed will help everyone adapt to this new chapter.
After a quieter summer and a cautious start to the fall market, October delivered the clearest sign yet that Toronto’s real estate landscape is stabilizing. Sales activity continued to improve, inventory eased from September’s surge, and prices held firm month-over-month. While the market is not roaring forward, October showed a meaningful shift in sentiment as buyers re-engaged and competition tightened slightly across several segments.
Below is a full breakdown of how the market performed and what it means for buyers and sellers heading into the final stretch of the year.
October at a Glance
Sales: Up 9.76% month-over-month
New Listings: Down 16.57% month-over-month
Active Listings: Down 5.40% month-over-month
Average GTA Price: Down 0.47% month-over-month
Average Days on Market: 50 days (down from 51 in September)
October 2025 Toronto Real Estate Market Update
GTA Market Overview
October delivered a second consecutive month of sales growth, rising nearly 10% from September. Buyers who had previously stepped to the sidelines over the summer began returning, encouraged by improved affordability expectations, increased negotiation power, and a sense that prices may have reached a temporary floor after months of softening.
Inventory also pulled back in October. New listings dropped more than 16% month-over-month, and active listings declined just over 5%. While supply remains higher than last year, the month-over-month easing helped bring the market closer to balance. With fewer new listings coming online, sellers benefited from slightly less competition than they faced in September.
Prices remained stable, dipping less than half a percent. Considering the broader downward pressure over the past year, October’s minimal price movement suggests values may be flattening as the market finds an equilibrium between what sellers are willing to accept and what buyers are prepared to pay.
Key Takeaway: October showed improving buyer engagement and tightening inventory – two key ingredients for price stabilization.
Key Market Drivers in October
Improved Buyer Confidence The fall market saw stronger engagement as buyers adjusted to borrowing costs and gained clarity around pricing. This confidence translated into increased sales activity across both freehold and condo segments.
Inventory Eased After a September Surge September’s spike in listings created temporary pressure on prices. With fewer new listings in October, buyers had less choice, helping restore some balance.
Price Stability Encouraged Move-Ups and First-Timers Stable pricing helped both move-up buyers and first-time purchasers make more confident decisions, especially in the condo and semi-detached segments.
GTA Market Performance: Month-Over-Month
Sales increased by 9.76% (+546 sales)
New listings declined by 16.57% (-3,191 listings)
Active listings dropped by 5.40% (-1,586 listings)
Average price decreased slightly by 0.47% (-$5,005)
Days on Market improved from 51 to 50 days
Key Takeaway: The combination of rising sales and falling listings is a positive directional shift for market balance.
GTA Market Performance: Year-Over-Year
Sales down 7.81% from October 2024
New listings up 4.83% from last year
Active listings up 13.59% from last year
Average price down 7.12% year-over-year (-$80,843)
Days on Market up 16.28% from last year (+7 days)
Key Takeaway: While the month-to-month narrative has improved, year-over-year comparisons continue to show a softer market with more choice and lower prices than last fall.
416 Market Breakdown by Property Type
Sales Activity (Month-Over-Month)
Detached: Up 10.67% (+72 sales)
Semi-Detached: Up 22.90% (+49 sales)
Townhouse: Up 13.64% (+30 sales)
Condo: Up 14.04% (+132 sales)
Sales growth was seen across all housing types, marking one of the broadest improvements this year. Semi-detached homes led the month, followed closely by the condo sector, which regained momentum after a slower summer.
Key Takeaway: Buyer interest strengthened across all segments, showing renewed confidence in the market.
Pricing Trends (Month-Over-Month)
Detached: Down 3.97% (-$66,966)
Semi-Detached: Up 3.18% (+$37,582)
Townhouse: Down 4.19% (-$38,919)
Condo: Up 2.66% (+$18,126)
Freehold properties saw mixed performance. Detached and townhouse values experienced modest declines, while semis posted the strongest price gains of the month. Condos also saw average prices rise, supported by an uptick in demand and more motivated fall buyers.
Key Takeaway: Semi-detached homes stood out as the strongest performer, while condos continue to offer value-driven opportunities for buyers.
October 2025 Toronto Real Estate Market Update
What This Means for Buyers
With inventory easing and sales strengthening, buyers considering a purchase in the next three to six months may want to take advantage of current conditions. Prices have shown signs of stabilizing, and as competition picks up, the negotiation leverage seen through the summer could begin to narrow.
Key Takeaway: Buyers still hold advantages, but conditions are shifting. Acting before inventory tightens further could be beneficial.
What This Means for Sellers
October offered sellers a more encouraging landscape than earlier in the fall. With fewer new listings entering the market, properly priced homes saw more consistent showings and engagement. Attractive, well-prepared properties continue to see the strongest results.
Key Takeaway: Sellers who position their home strategically and price with the current market will find more motivated buyers than in recent months.
Our Take
October marked an important turning point for Toronto real estate. While we’re not seeing dramatic price growth or frenzied bidding wars, the combination of stronger sales and softer listing numbers suggests the market is working toward balance. Confidence has improved, and both freehold and condo buyers are moving more decisively than they did over the summer.
Heading into the final months of the year, the market appears more stable and predictable than it has been for most of 2025. For both buyers and sellers, clarity is returning, and informed strategies are key. As always, reach out any time if you’d like to learn more!